Air Monitoring Data & Site Map
To jump immediately to the map below, click here.
Honeywell's goal was to prevent exposure to dust that could contain chromium to on-site workers, neighboring businesses, and residents.
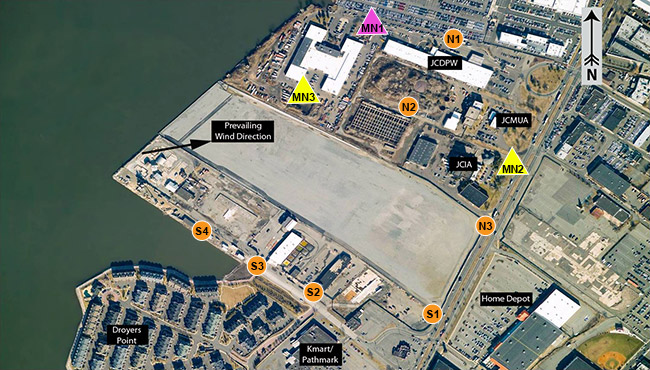
The air monitoring system started with the measurement of background concentrations of both dust and hexavalent chromium. The air monitoring system, remained in place, measuring both dust and chromium levels at the site and around its perimeter. The placement of the monitors provided coverage for wind coming from any direction. The system used both fixed and worker mobile air samplers.
Dust Monitoring
The New Jersey Department of Environmental Protection (DEP) established dust criteria. Because there was lead in the soil of the former Jersey City properties, the dust limit was 221 micrograms of dust per cubic meter of air (ug/m3). For the former Kellogg Street properties, where lead in soil was not a concern, the DEP established a dust limit of 339 micrograms of dust per cubic meter of air (ug/m3). Since only dust can be measured in real time, it served as a surrogate for both the hexavalent chromium and the lead that could have been generated by the remediation.
Although DEP established separate dust levels for the two areas, Honeywell voluntarily used the lower level (221 ug/m3) at the Kellogg Street properties.
The dust control measures used during construction activities were designed to keep the concentration below the "action level" of 221 ug/m3. To guard against reaching the action level, a warning level of 125 ug/m3 was established. Charts showing dust levels were posted about 24 hours after being collected to allow time for validation by laboratory experts.
Chromium Monitoring
Chromium cannot be measured directly in air so air samples were taken daily and sent to an off-site independent laboratory for analysis. This data was posted on the website throughout the remediation.
Warning Levels / Action Taken
During remediation the air monitoring program had strict engineering protocols in place. Water was applied to the excavated soil to suppress dust before it is put in sealed containers and moved offsite.
Chromium and dust air monitoring results were posted both at the site and below. Other metals were measured and those results are available by request.
Honeywell has completed a number of cleanups in Jersey City and has met all government standards, including those for air quality, at all times.
Charts showing background dust monitoring levels can be accessed using the map below. To view the data collected, select the date from the drop-down list and click "Change" (dates not shown in the list have no data available). Then, click on a monitor icon to view the data. If data from a particular monitor is unavailable, the monitor icon will not be clickable when that date is selected. Click "View wind direction & speed" to see a graph of the wind conditions for the selected date.
View wind direction & speed gathered from Monitor N1 on December 12, 2016
View wind direction & speed gathered from Monitor S4 on December 12, 2016
Legend
 Stationary Total Dust / Hexavalent Chromium Monitor
 Mobile Total Dust Monitor
 Mobile Total Dust / Hexavalent Chromium Monitor
Note: Locations of Mobile Monitoring Stations will be selected based upon daily activities and wind directions.